From a passing visit
to a clearer picture.
Know how people find you, what they do, and which visits lead to revenue. One place to make sense of your site.
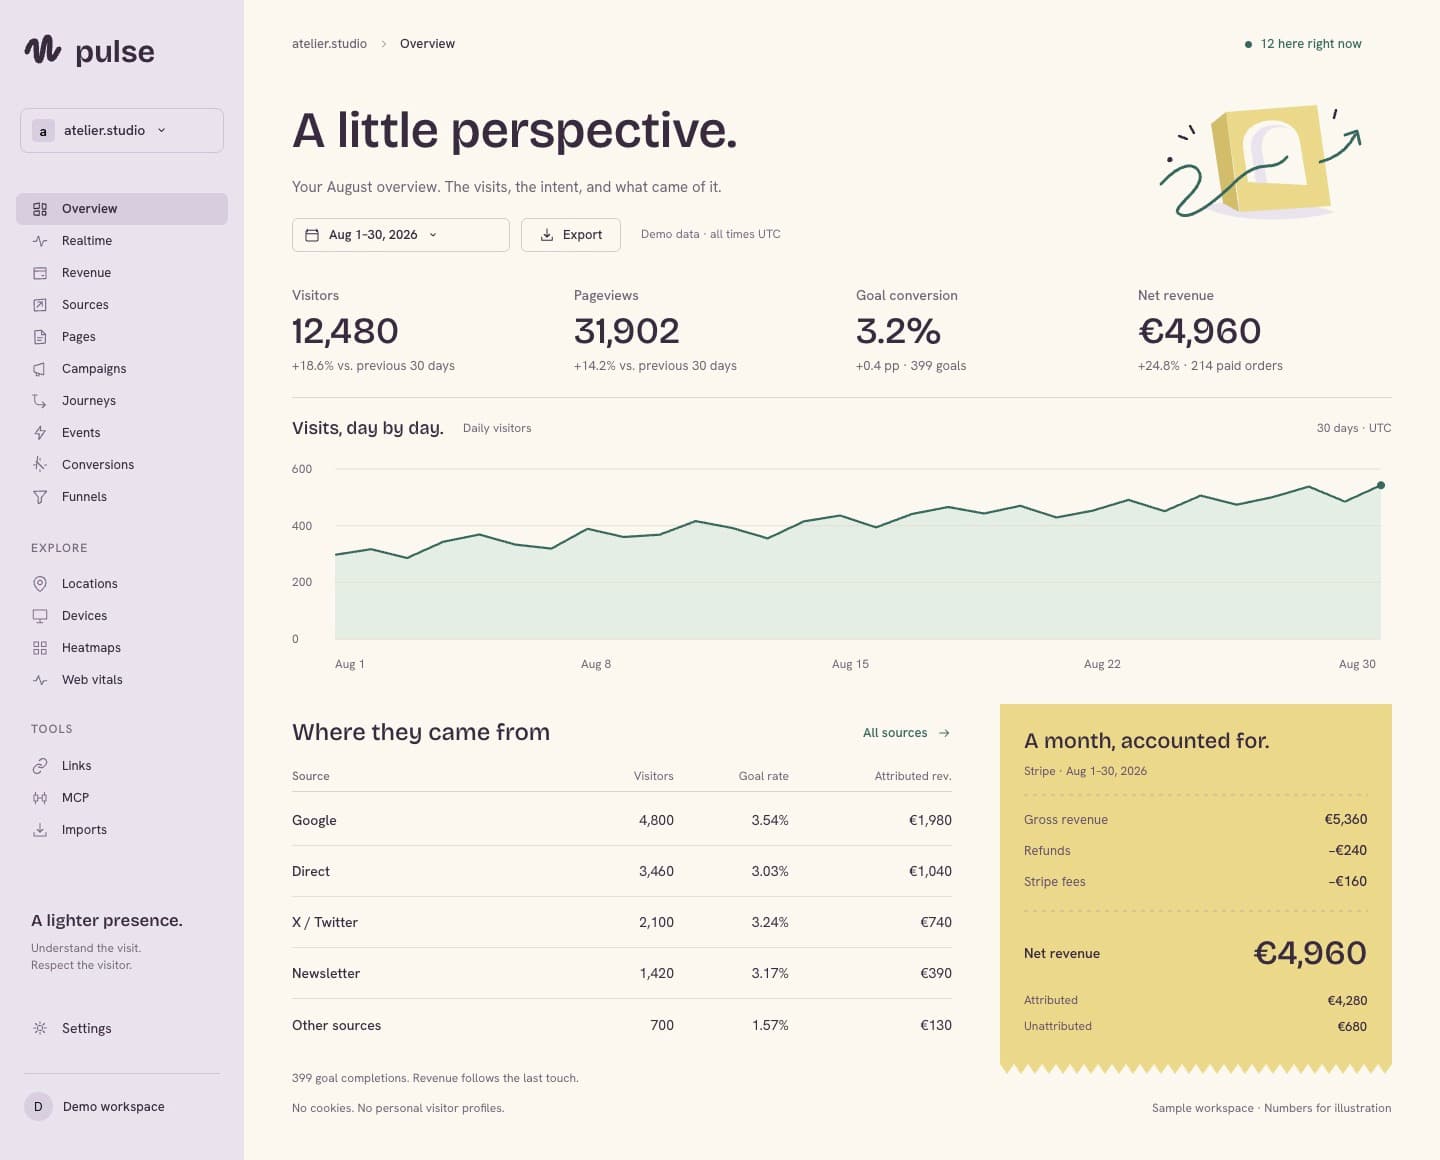
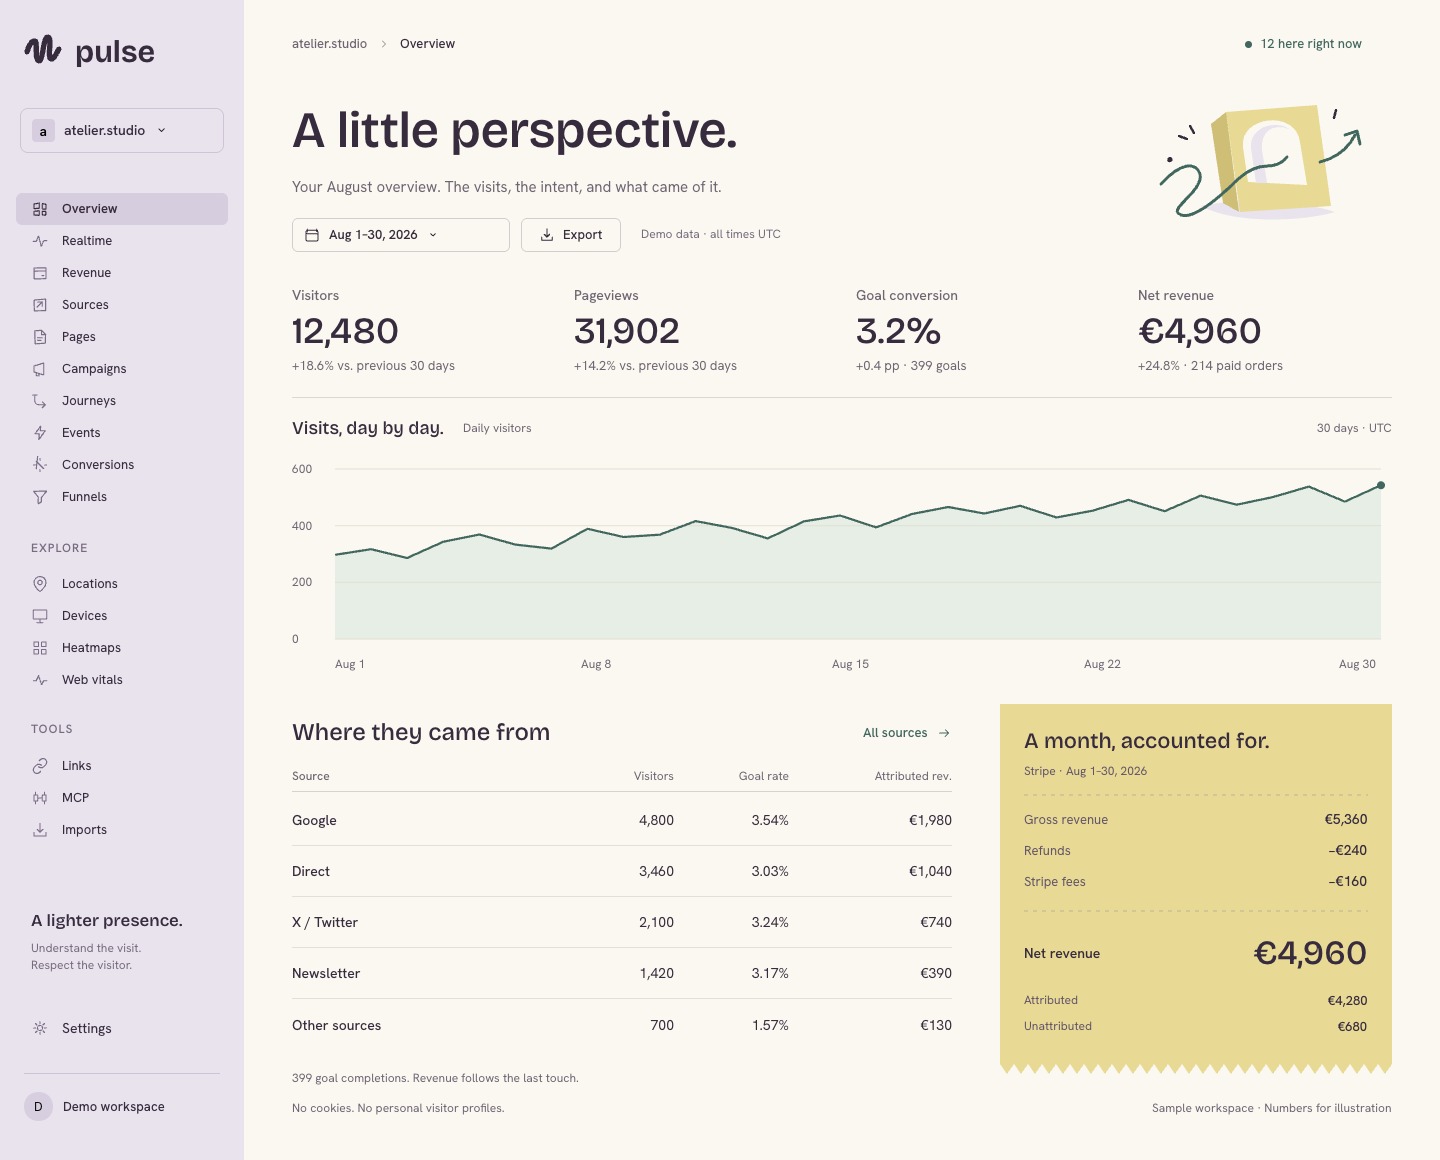
Every part of the visit.
In the same picture.
Find your point of departure.
Know what brings people through the door.
See sources, pages, campaigns, devices, and locations. Go from the monthly pattern to the visits arriving right now.
Explore web analytics ↗Give every shared link a clearer story.
Build a tagged short link, reuse your UTM presets, and download its QR code. Follow the clicks and tracked visits that come next.
Explore campaign links ↗See the steps in between.
A useful place to ask why.
Find the moment worth improving.
Connect pages and events into a funnel. Follow journeys, measure goals, and see where the path to a signup or purchase gets quieter.
Explore journeys & conversions ↗Help the next visit feel better.
Explore click patterns by screen size and real-world Web Vitals. Find the pages that deserve a closer look.
Explore heatmaps & performance ↗Make something of the picture.
See what the traffic brings.
Connect Stripe. Put sales, refunds, fees, and net revenue beside the sources behind them, with unmatched payments kept visible.
Explore revenue attribution ↗Give useful observations a wider audience.
Invite your team, share a public dashboard, or embed a compact stats widget. Keep the right people in the loop.
Explore teams & sharing ↗Fits into the way
you already work.
Bring your previous analytics with you. Share a report with your team. Give your tools a little more context.
Explore integrations ↗Bring your history
Import supported CSV exports from Google Analytics, Plausible or Fathom.
Keep the team in the loop
Get daily or weekly digests in Slack and email, and export reports when you need them.
Take your numbers further
Read site aggregates through a scoped REST API key or MCP tools.
Useful insight.
Room for privacy.
The default tracker counts visits without analytics cookies or browser storage. It respects Do Not Track and Global Privacy Control, and does not store raw IP addresses.
Daily visitor identifiers reset at midnight UTC. Optional features have their own data requirements, explained in our privacy notice.
Read how Pulse handles data ↗More ways to make
sense of your site.
From a QR code on a poster to a report shared with your team. Explore the tools inside Pulse, and find the ones that answer your next question.
45 capabilities · 8 areas to exploreTraffic & audience6 features
Understand who arrives, where they come from and what they read.
Live visitors
See current visitors, their pages and their locations on an interactive map.
Sources & campaigns
Compare referrers and UTM campaigns to see what brings people in.
Page performance
Find your most visited pages and follow their traffic over time.
Location breakdowns
Explore countries, regions and cities with a map that adapts as you zoom.
Devices & browsers
Understand your audience through device, browser and operating system breakdowns.
Date ranges & comparisons
Change the reporting period and compare key metrics with the previous period.
Journeys & conversions7 features
Connect visits to the actions that matter to your business.
Custom events
Send named events from your site to measure actions beyond page views.
Click, form & URL rules
Define event rules for clicks, form submissions and matching URLs with the full tracker.
Page & event goals
Turn a visited page or named event into a goal with conversion counts and rates.
Multi-step funnels
Build funnels with two to eight page or event steps to see where visitors drop away.
Suggested funnels
Start from funnel suggestions drawn from your traffic and save the paths worth watching.
PostHog funnel import
Bring supported PostHog funnel definitions into Pulse with a one-way import.
Visit timelines
Follow the recorded pages and events within a visit, with source and location context.
Experience & performance5 features
See where people click and where your site needs attention.
Click heatmaps
See where clicks gather on a page with heatmap collection enabled in the full tracker.
Heatmaps by device
Filter click heatmaps by device to inspect mobile and desktop behaviour separately.
Five performance metrics
Collect LCP, INP, CLS, FCP and TTFB from supported visitor browsers with the full tracker.
Performance at p75
Read performance at the 75th percentile alongside sample counts and quality ratings.
Pages needing attention
Find pages with the highest p75 LCP, INP and CLS to focus your next improvements.
Revenue & attribution5 features
Put Stripe revenue beside the traffic that helped generate it.
Stripe connection
Connect Stripe to bring payment activity into your analytics workspace.
Last-touch attribution
Connect payments with an attribution ID to their last recorded visit context.
Revenue by source & page
Compare attributed revenue across sources and pages to see what contributes sales.
Refunds, fees & net revenue
Read gross revenue, refunds, disputes and processor fees alongside net revenue.
Unattributed payments
Keep payments without an attribution ID visible without assigning them a guessed source.
Links & campaigns5 features
Give every campaign a clear link and a measurable outcome.
Short links
Create a short link with your chosen slug and destination for each campaign.
Five UTM fields
Set source, medium, campaign, content and term to keep campaign traffic recognisable.
Saved link templates
Reuse saved campaign settings when creating the next link.
Downloadable QR codes
Download an SVG QR code for a tracked link to use in print or on screen.
Link outcomes
Check a link's click counter and date-ranged visitors, goal events and attributed revenue.
Teams & sharing6 features
Keep your sites organised and put the right reports within reach.
Multiple sites
Manage several sites in a workspace and switch between their reports.
Team invitations
Workspace owners can invite teammates with an admin or viewer role.
Shared dashboards
Share a read-only dashboard by public link, then disable sharing or rotate its token.
Embeddable stats widget
Add a compact public stats widget to another page with an iframe embed.
Site identity
Set a site's name, logo and chart colour to make its workspace easier to recognise.
Email & Slack digests
Send a daily or weekly summary to your inbox or a configured Slack channel.
Integrations & data access6 features
Use your analytics in the tools and workflows you already have.
Read-only MCP tools
Give a compatible MCP client access to site totals, breakdowns and live visitor counts.
REST API
Read stats and breakdowns from your own tools using a site API token.
Repository CLI
Run the CLI included in the repository to read stats, breakdowns and live counts.
Collection hostname
Use a configured collection hostname for your tracker after completing the required DNS setup.
CSV exports
Download report data as CSV for analysis outside Pulse.
Historical CSV import
Import supported historical CSV exports from Plausible, Fathom, GA4 or a compatible file.
Privacy by design5 features
Measure your site with clear limits on what gets collected.
Cookieless visit counting
Count visits without analytics cookies or browser storage used for visitor counting.
Browser privacy signals
The tracker respects Do Not Track and Global Privacy Control by not sending events.
Daily visitor hashes
Count visitors with a daily hash and a secret that changes each UTC day.
No raw IP persistence
Process location and visitor counting without storing a visitor's raw IP address.
Bot filtering
Exclude detected bots from analytics event quota so automated traffic does not use your allowance.