A clearer picture.
Better next steps.
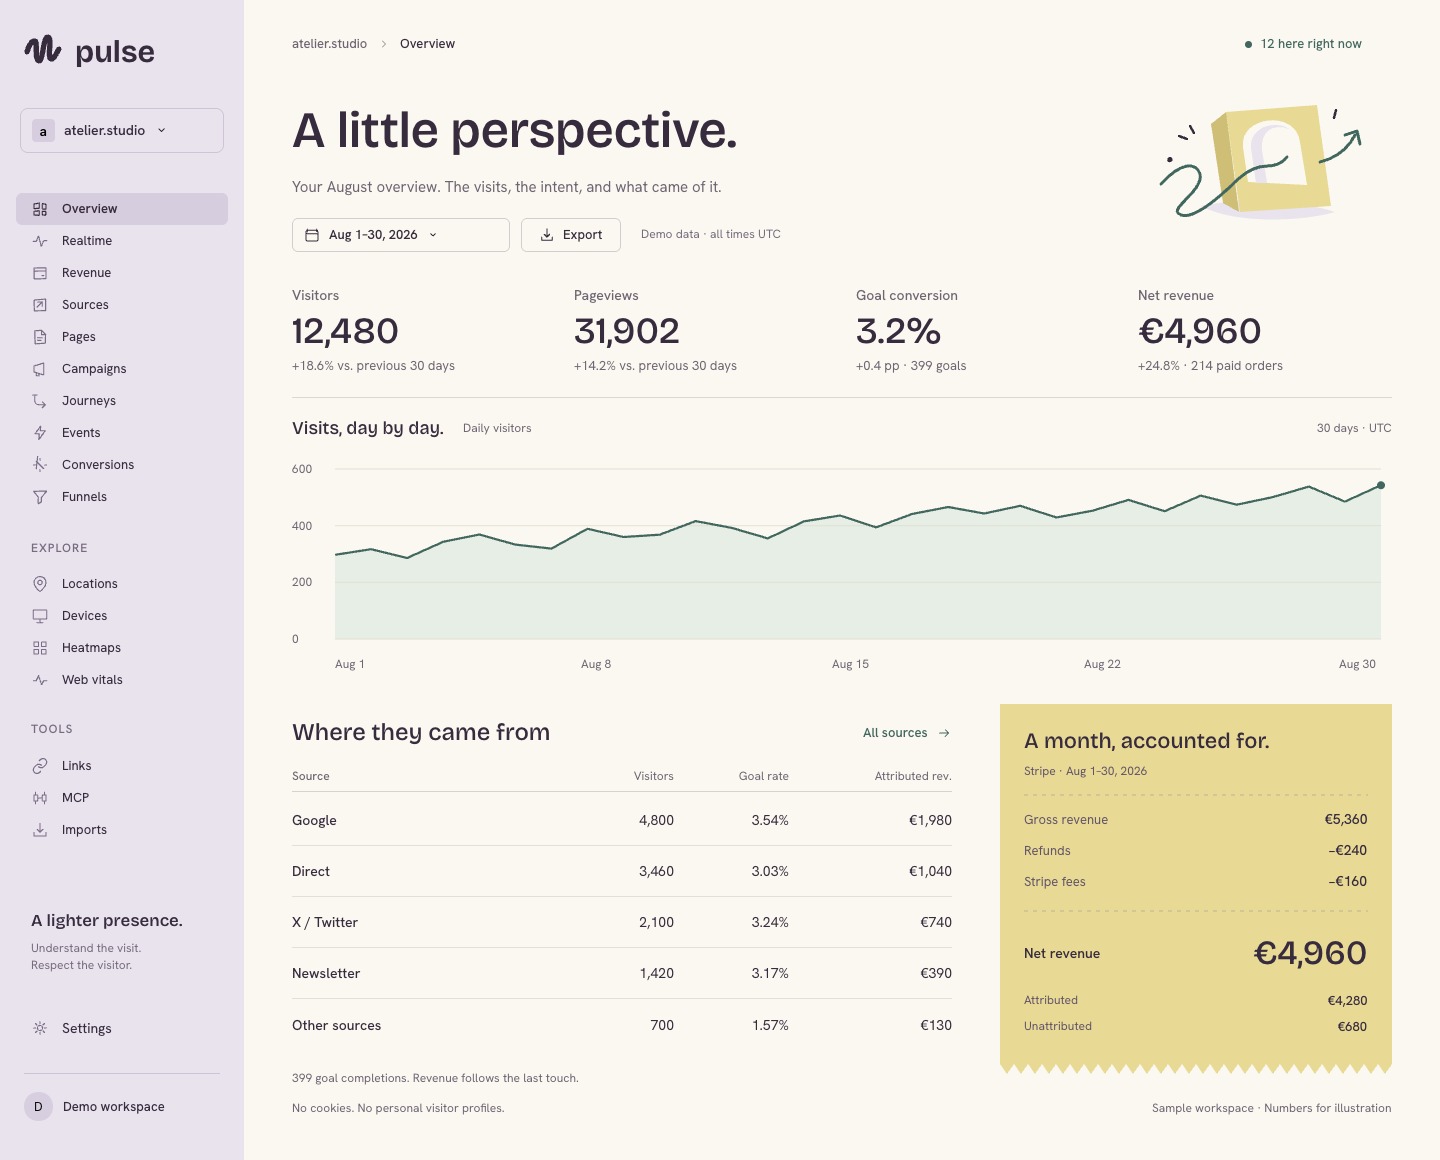
Understand how people find your site, what they do and what leads to revenue. Web analytics with room for curiosity — and respect for privacy.
15-day trial. No card required. No analytics cookies.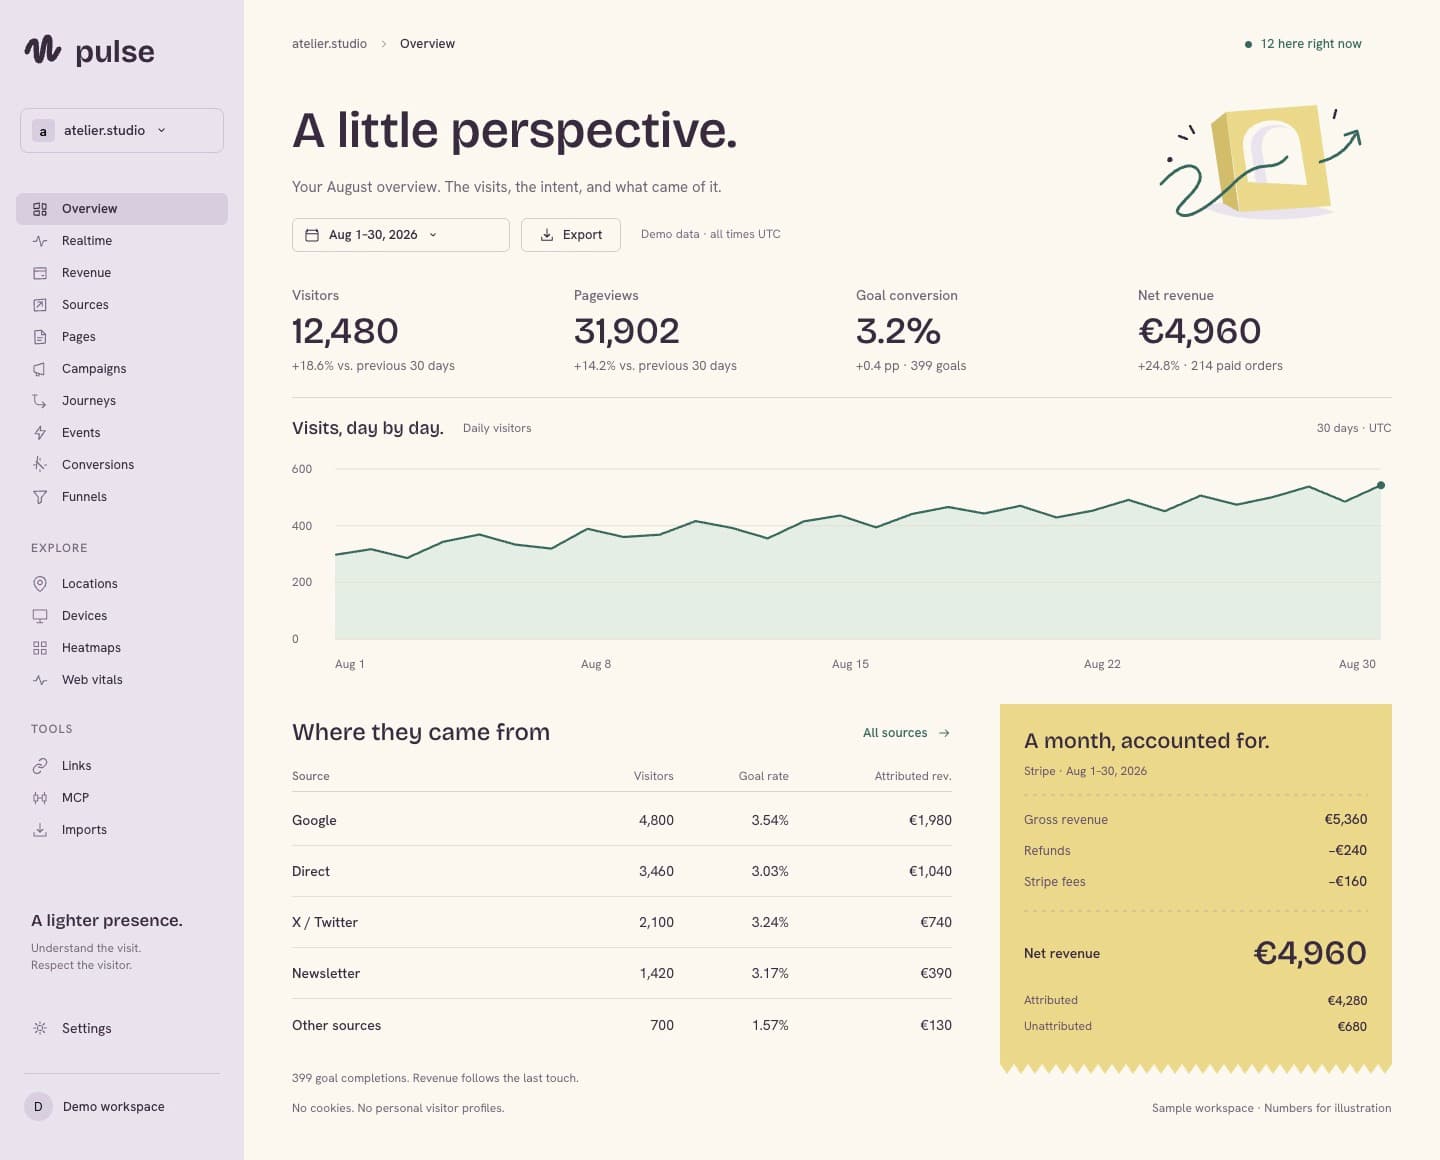
Find the signal in your everyday traffic.
Where people find you.
Read traffic sources, campaigns, pages and countries together. See which channels bring visitors to your site, and follow activity in real time.
Explore traffic analytics ↗A little world of activity.
Explore these example visits on Pulse’s interactive map.
Example visits. Approximate city locations.How your site feels.
Collect real visitor Web Vitals to understand loading speed, responsiveness and visual stability. Enable performance collection on your tracker to start receiving measurements.
Explore Web Vitals ↗A different screen. A different experience.
Illustrative aggregate clicks and Web Vitals. The coordinate plot represents positions on a page; it is not a screenshot or a session recording.
Useful beyond the dashboard.
Share reports with your team, receive scheduled digests, export your results and give your tools access to site aggregates through the API or MCP.
Explore team workflows ↗Same story. A different window.
Public sharing is visible to anyone with the link while enabled. This example changes the preview only; it does not create a shared link.
See where the journey gets interrupted.
Build funnels from your tracked events and spot where people leave between steps. Turn a question about sign-ups or purchases into a journey you can measure.
Explore funnels and journeys ↗Last-touch attribution links the payment to its last recorded source. It does not describe every influence on a purchase.
Know what brings more than visits.
Connect Stripe and configure payment attribution to associate eligible purchases with their last tracked visit. Compare the sources and campaigns behind attributed revenue.
Revenue reporting requires Stripe and attribution setup. Unattributed payments stay separate.Explore revenue attribution ↗Understand your site.
Give your links a purpose.
Analytics starts on your website. Pulse Links starts wherever you share it: a newsletter, a social post or a QR code. Create tagged short links, then read the resulting tracked visits in Analytics — in the same workspace.
Discover Pulse Links ↗Links is free. Start a separate 15-day Analytics trial whenever you need website reporting.